User guide
Everything you need to read the indicators and set them up the way you trade. Sections marked Multi-timeframe only apply to the Full edition.
01Getting started
Add the indicator to your chart
- Free edition: on TradingView, open Indicators › Community scripts, search for IRL/ERL Orderflow Indicator Free and click it. Add it to your favorites to find it quickly.
- Full edition (with Key Levels): once your access is active (free beta, then subscription on the TradingView Marketplace), the script appears under Indicators › Invite-only scripts. The Key Levels are built in, no second indicator to add.
First settings
- Multi-timeframe edition: the higher timeframes are off by default. Open the settings (double-click the indicator name) and tick Enable multi-timeframe FVGs (higher timeframes).
- The time tools (killzones, day separators, days) always use New York time, whatever the time zone of your chart.
- To save your setup, use Defaults › Save as default at the bottom of the settings window.
02Reading the chart
| On the chart | Meaning |
|---|---|
Colored zone + label H1 ▲ | A Fair Value Gap of the current leg, with its timeframe and direction (▲ bullish, ▼ bearish). Chart-timeframe gaps are teal (bullish) or red (bearish); higher-timeframe gaps use the color of their timeframe. |
| Dashed line | The leg's extreme liquidity (ERL): the target of the leg. Green = buy-side (above), pink = sell-side (below). Higher-timeframe targets carry their timeframe label. |
| Dotted orange line | The invalidation swing: the first swing against the move after price retraced into the leg. |
tgt:1.0845 in a label | The level targeted by the gap's leg (option). tgt:— means the target is not frozen yet. |
| Red-tinted gap | Multi-timeframe A lower-timeframe gap pointing against the higher-timeframe gap price is in. |
| Full-height colored bands | The killzones of the current day. |
Vertical dotted lines, MON … FRI | Day separators at New York midnight and day names. |
| Thin gray horizontal line | A manual removal level (section 5). |
03The life of a leg
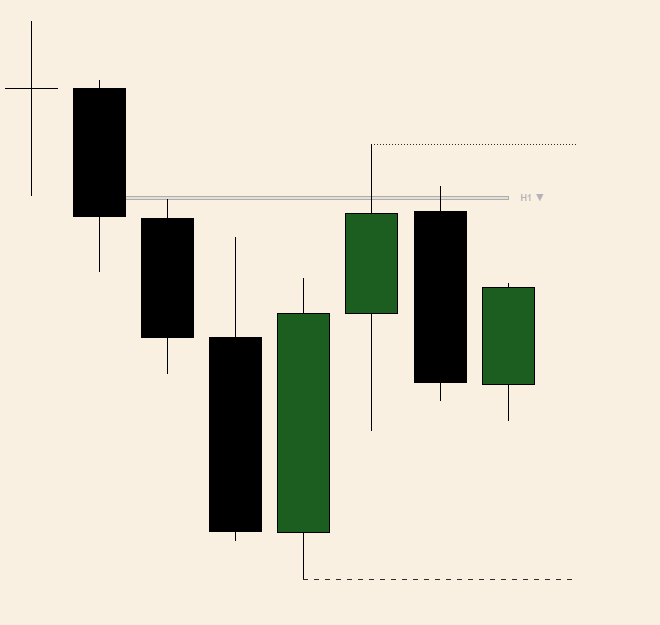
- The leg leaves its gap (IRL). A leg starts from a confirmed 3-candle swing. Only the gaps of the current leg are shown, in one direction at a time.
- Price comes back into the gap. The extreme of the leg (its low here) is frozen: it becomes the target, drawn as a dashed line.
- The invalidation swing appears. The first confirmed swing against the move is captured (dotted line).
- The outcome. Price takes the target: the leg is done, its gaps and its line are removed. Or price touches the swing: the gaps are removed; a close beyond it resets the leg.
When does a gap disappear?
- Price entered it, then a candle closed beyond it.
- The leg's target was taken.
- The invalidation swing was touched.
- A new leg started (new swing + new gap), or a gap formed in the opposite direction.
- More than 20 chart-timeframe gaps: the oldest one makes room.
Everything is calculated on closed candles: nothing appears and disappears inside a candle. If a candle makes a new extreme and comes back into the gap in the same bar, the indicator reads the lower timeframe to place the target at the level reached before the pullback.
04Multi-timeframe Multi-timeframe
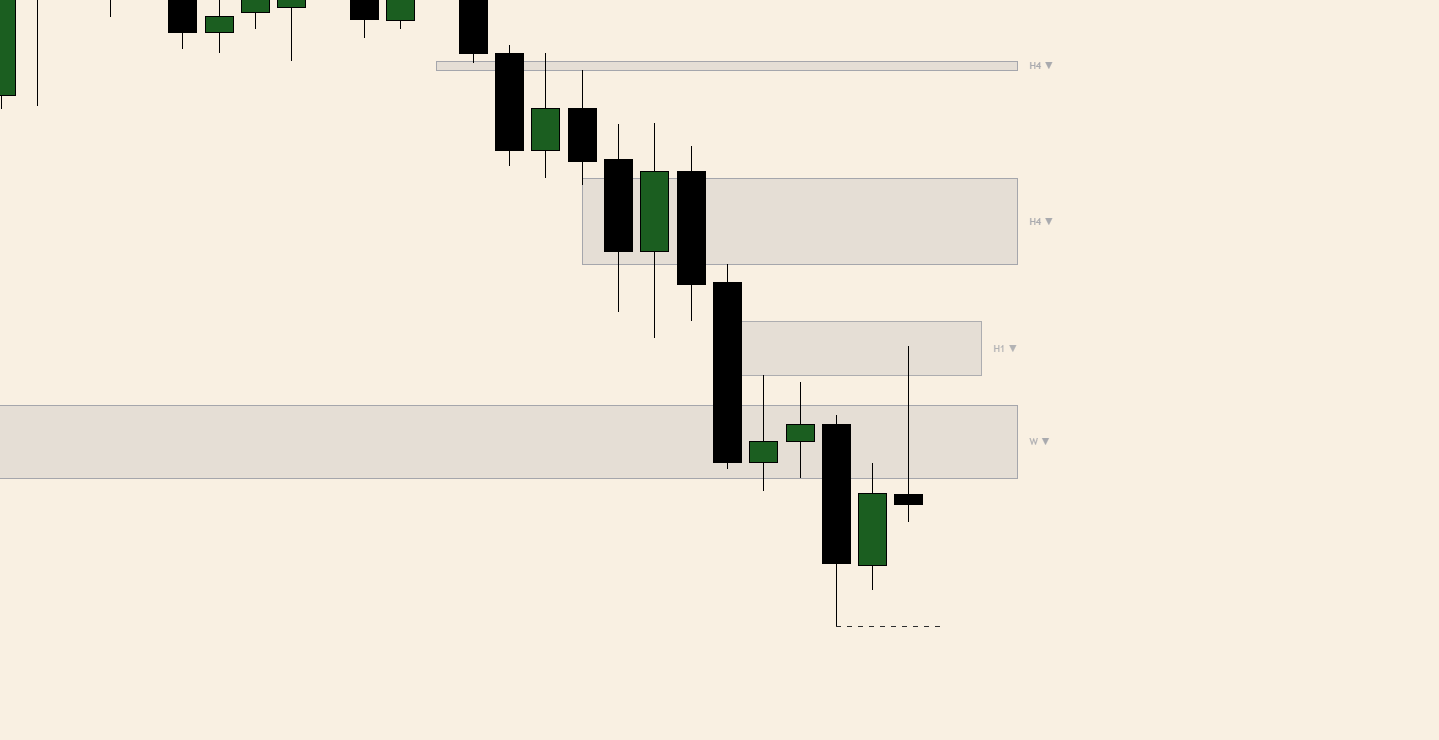
Choose your timeframes
Tick Enable multi-timeframe FVGs (higher timeframes), then enable the timeframes you follow (M5 to Monthly) and pick their colors. Only timeframes higher than your chart are shown: on an H1 chart, the M5 and M15 boxes have no effect.
Each timeframe runs the same rules as the chart (its own swings, legs, targets and invalidation). Higher-timeframe data comes from closed higher-timeframe candles only: a Daily gap appears once its third candle has closed, and never repaints.
Priority to the higher timeframe
When a lower-timeframe leg and a higher-timeframe leg aim at the same extreme liquidity (within “Same extreme liquidity” tolerance (ticks), 4 ticks by default), only the higher-timeframe gaps are kept. Untick Priority: keep only the higher-timeframe FVGs when the extreme liquidity is shared to see everything.
Opposing FVGs
When price is inside a higher-timeframe gap, lower-timeframe gaps pointing the other way are recolored, so you instantly see which ones go against it.
- Minimum timeframe of the triggering gap: Daily by default (a Daily, Weekly or Monthly gap triggers the coloring).
- Trigger mode: Price inside the zone (only while the close is inside the gap) or Zone touched (while valid) (from the first touch, as long as the gap is on the chart).
Stock trading mode
Enable stock trading mode (3M / 6M FVGs) adds quarterly and semi-annual gaps, for Daily, Weekly and Monthly charts. It needs enough history: at least three closed candles of 3 or 6 months.
Also draw the liquidity of higher-timeframe FVGs controls the higher-timeframe target lines.
05Manual leg removal
Once in a while, a sweep happens without being detected and a leg stays on the chart. You can remove it by hand:
- In the settings, group Manual leg removal, tick Enable manual removal.
- In Level 1, enter the price of the leg's target line (the dashed line). An approximate value is enough. To read the exact level, tick Show the liquidity target in the FVG label: it shows
tgt:next to each gap. - The leg disappears with its gaps and its line, on every timeframe. Other assets are never affected: the match is done by price, within Tolerance (ticks) (10 by default).
Leave the level in place as long as you want the leg hidden, and set it back to 0 to switch it off. Three levels are available.
06Killzones, separators and days
| Tool | Details |
|---|---|
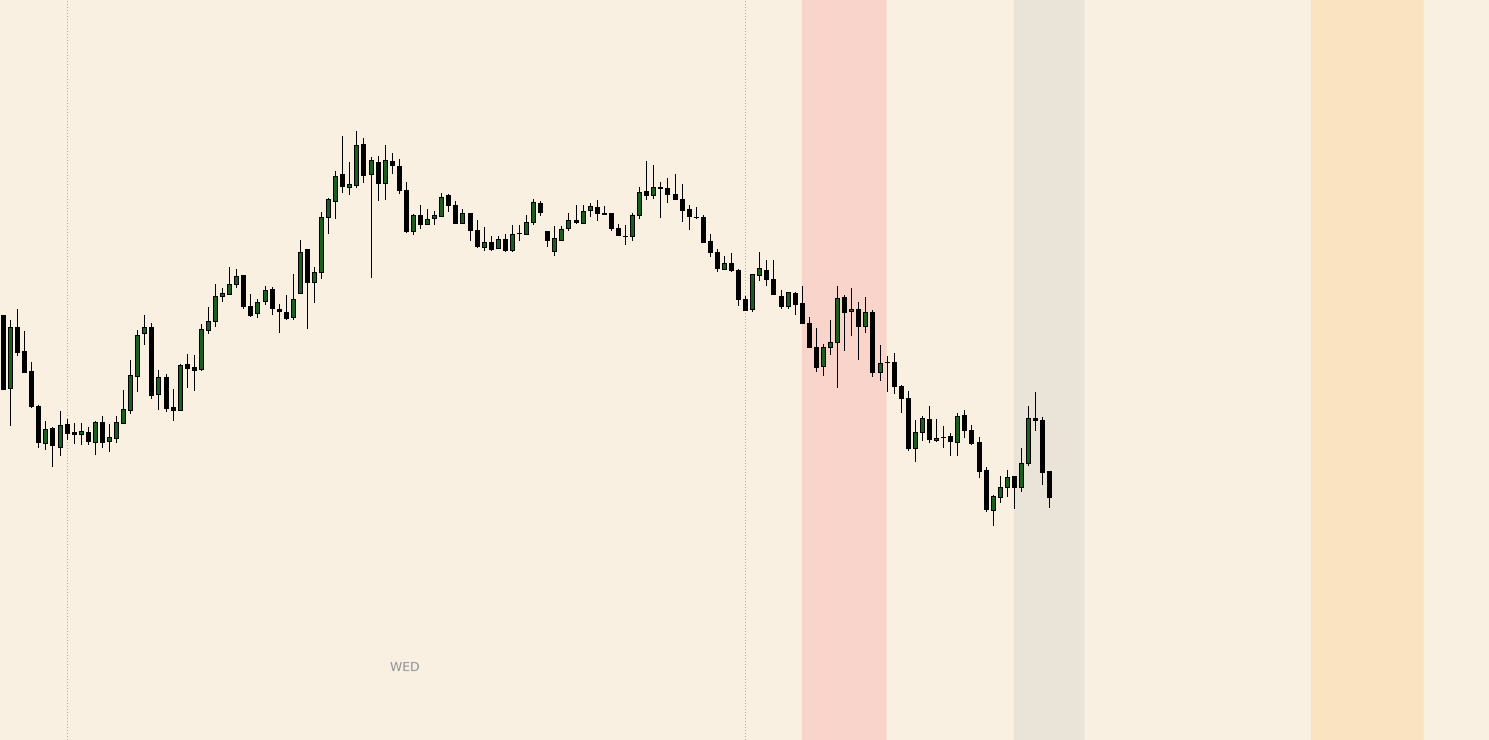
| Killzones | Full-height bands for the current day, drawn from the start of the day so you see them ahead of time. Intraday charts only. Defaults (New York time): Asia 2000-0000, London 0200-0500, NY AM 0700-1000, NY PM 1330-1600. Each one can be switched off, moved (format HHMM-HHMM) and recolored. |
| Day separators | A vertical line at each New York midnight, for the current week, on H4 and below. Color, style and width are adjustable. |
| Days of the week | The day name at noon New York time, for the current week, on H1 and below, at the bottom or top of the chart. |
Everything follows the candle being processed, so it also works in Bar Replay.
07Settings reference
| Setting | What it does | Default |
|---|---|---|
| Show only the FVGs of the latest leg | The core filter: only the current leg's gaps stay on the chart. | On |
| Extend zones to the right · Extend zones past the last bar (bars) | Zones follow price, and go a few candles beyond the last one. | On · 1 |
| Show label (TF + direction) on the right | The H1 ▲ label of each gap. | On |
| Bullish FVGs — zone / border · Bearish FVGs — zone / border | Show or hide each direction, with fill and border colors. | On |
| Draw the leg — color | A line from the starting swing to the current price. | Off |
| Draw the extreme liquidity when price retraces into an FVG | The target line of the leg. | On |
| Hide chart-timeframe liquidity on M1 (1 min) | Keeps M1 charts light. | On |
| Remove the line when liquidity is taken | Off: the line stays on the chart, frozen where it ended. | On |
| Remove the leg's FVGs when its liquidity is taken | Taking the target closes the leg. | On |
| Show the liquidity target in the FVG label | Adds tgt: to each label. | Off |
| Invalidate the leg when the retracement swing is swept | The swing invalidation rule. | On |
| Keep the extreme liquidity when the swing invalidates the leg | The gaps go, the target line stays. | Off |
| Draw the retracement swing line | The dotted invalidation line (color, style, width). | On |
Multi-timeframe, manual removal and time tools settings are described in their own sections. Hover the ⓘ icons in TradingView for a reminder of each setting.
08Key Levels
| Label | Level |
|---|---|
PDH / PDL | Previous day high / low |
PWH / PWL | Previous week high / low |
PMH / PML | Previous month high / low |
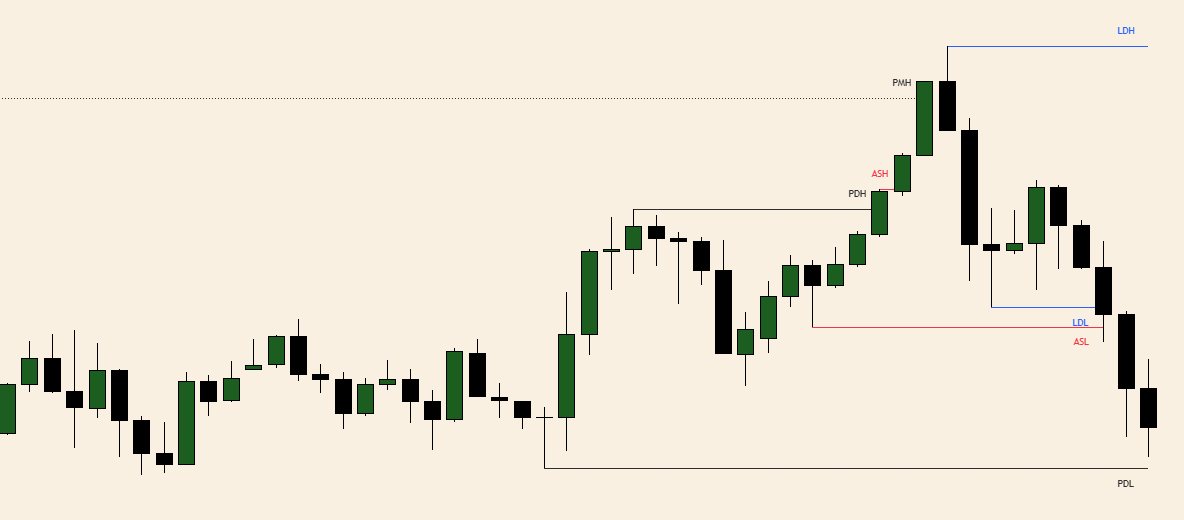
ASH / ASL | Asian session high / low (20:00–00:00 New York time by default) |
LDH / LDL | London session high / low (02:00–05:00 New York time by default) |
- Built into the Full edition, at the bottom of the settings. Enable Key Levels (PDH/PDL, PWH/PWL, PMH/PML, Asia, London) switches the whole module on or off.
- Each line starts on the candle that made the level and stops on the candle that trades through it: an unbroken line means the liquidity is still there.
- When two levels are at the same price, only the most important one is drawn: month > week > day > London > Asia (Merge overlapping levels (priority), tolerance Merge tolerance (ticks)).
- Session levels are shown on H1 and below. Their windows and Session time zone can be changed.
- Previous day, week and month levels follow the trading sessions of the symbol on TradingView.
09Alerts
Right-click the chart › Add alert, choose the indicator as Condition, then the alert:
- IRL/ERL:
New bullish FVG,New bearish FVG(chart timeframe, on closed candles). - Key Levels:
PDH break,PDL break,PWH break,PWL break(price crossing the level).
10A simple routine
- Top-down: start on a higher timeframe (Daily, H4) to see where price is in the bigger legs and which targets are open.
- Execution timeframe: go down to your timeframe. Read the current leg: its gaps, its target, its invalidation swing.
- Timing: use the killzones to focus on the moments you trade, and the Key Levels to know which liquidity is resting around.
- Context: a lower-timeframe gap recolored against a higher-timeframe gap deserves extra caution.
The indicators show the structure; they do not give buy or sell signals. The decisions stay yours.
11Troubleshooting
| Problem | Solution |
|---|---|
| Zones are not aligned with the candles | The indicator is on a separate price scale. Click the … next to its name › Pin to scale › choose the scale of the chart (right scale). TradingView remembers it. |
| No higher-timeframe gaps | Tick Enable multi-timeframe FVGs. Only timeframes higher than your chart are shown. 3M / 6M need the stock trading mode and enough history. |
| A gap disappeared | See “When does a gap disappear?” in section 3: this is the indicator doing its job. |
| No target line | The target only appears once price has come back into a gap of the leg. On M1 it is hidden by default. |
| No killzones | Killzones only show on intraday charts, for the current day. |
| No day names or separators | Day names: H1 and below. Separators: H4 and below. Both for the current week only. |
| No Asia / London levels | Session levels are shown on H1 and below. |
| The chart feels heavy | Disable the timeframes you do not use, or the opposing FVG coloring. |